Introduction
There are hundreds of modern technologies, from the compression that is used to store digital images from your phone to the generation of musical notes in a digital piano, that make use of Fourier transformations. But, what is a Fourier transformation? Put simply, the Fourier transform is a series of mathematical procedures which allow you to take any signal and discover what underlying frequencies it is made of. This is well demonstrated by an animation from Lucas V. Barbosa (available, Creative Commons):
Essentially, understanding what frequencies need to be added together to form a given wave (in red in the above animation) allows the creation of a frequency space (in blue in the above animation). By performing changes to a signal in frequency space, it is possible to do things such as removing only frequencies which are high or low. This is easier to think about with sound: have you ever listened to music on a bad pair of headphones and noticed that there is no bass? This is the result of an operation known as a high pass filter, where (in this case unintentionally) all of the low-frequency portions of the signal have been removed, leaving only the high-frequency signals. This same type of understanding can be extended to images, however, it can be hard to visualize due to the signals no longer being nice 1-dimensional lines. In this demo, we will: A) produce 2D fourier transforms from images; and B) show how these fourier transforms can be manipulated.
The Experiment
The demo at the bottom of this page is a simulation of a very simple experiment in physical optics,
which is diagrammed below:

It is constructed from four main parts:
- A laser and spatial filter are used to to produce a uniform light source by blocking light which is not a uniform spatial frequency.
- A lens is used to recolumnate the laser and an object you want to take a picture of is placed at the object plane.
- A lens is used to focus the image to a single point, called the Fourier plane.
- Finally, the image is recombined using another lens and captured on a camera (on the right of the diagram).
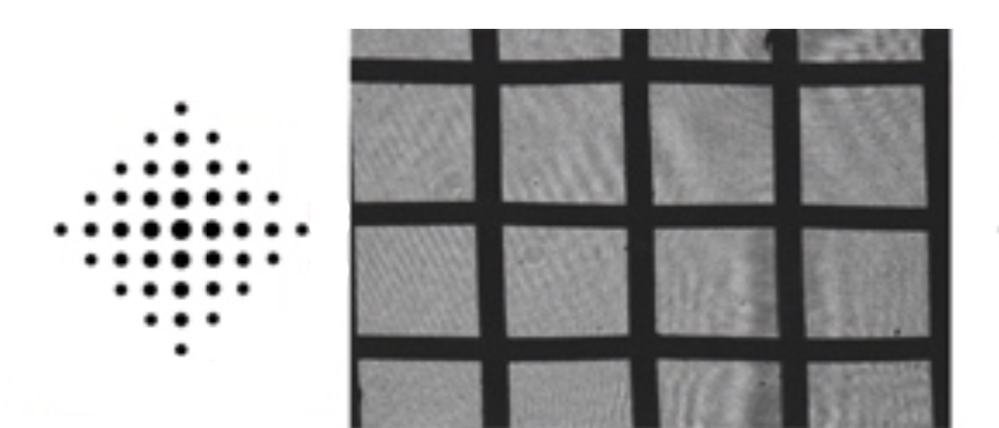
Where on the left is the Fourier pattern and the right is a picture of a metal grid which was placed in the object plane. You can see that, because the metal grid has black lines that are spaced evenly, it results in a fourier pattern which has evenly spaced dots along the X and Y axes. In the same way that a high-pass filter is described above for sound, it is possible to filter this Fourier pattern to change the resulting image:
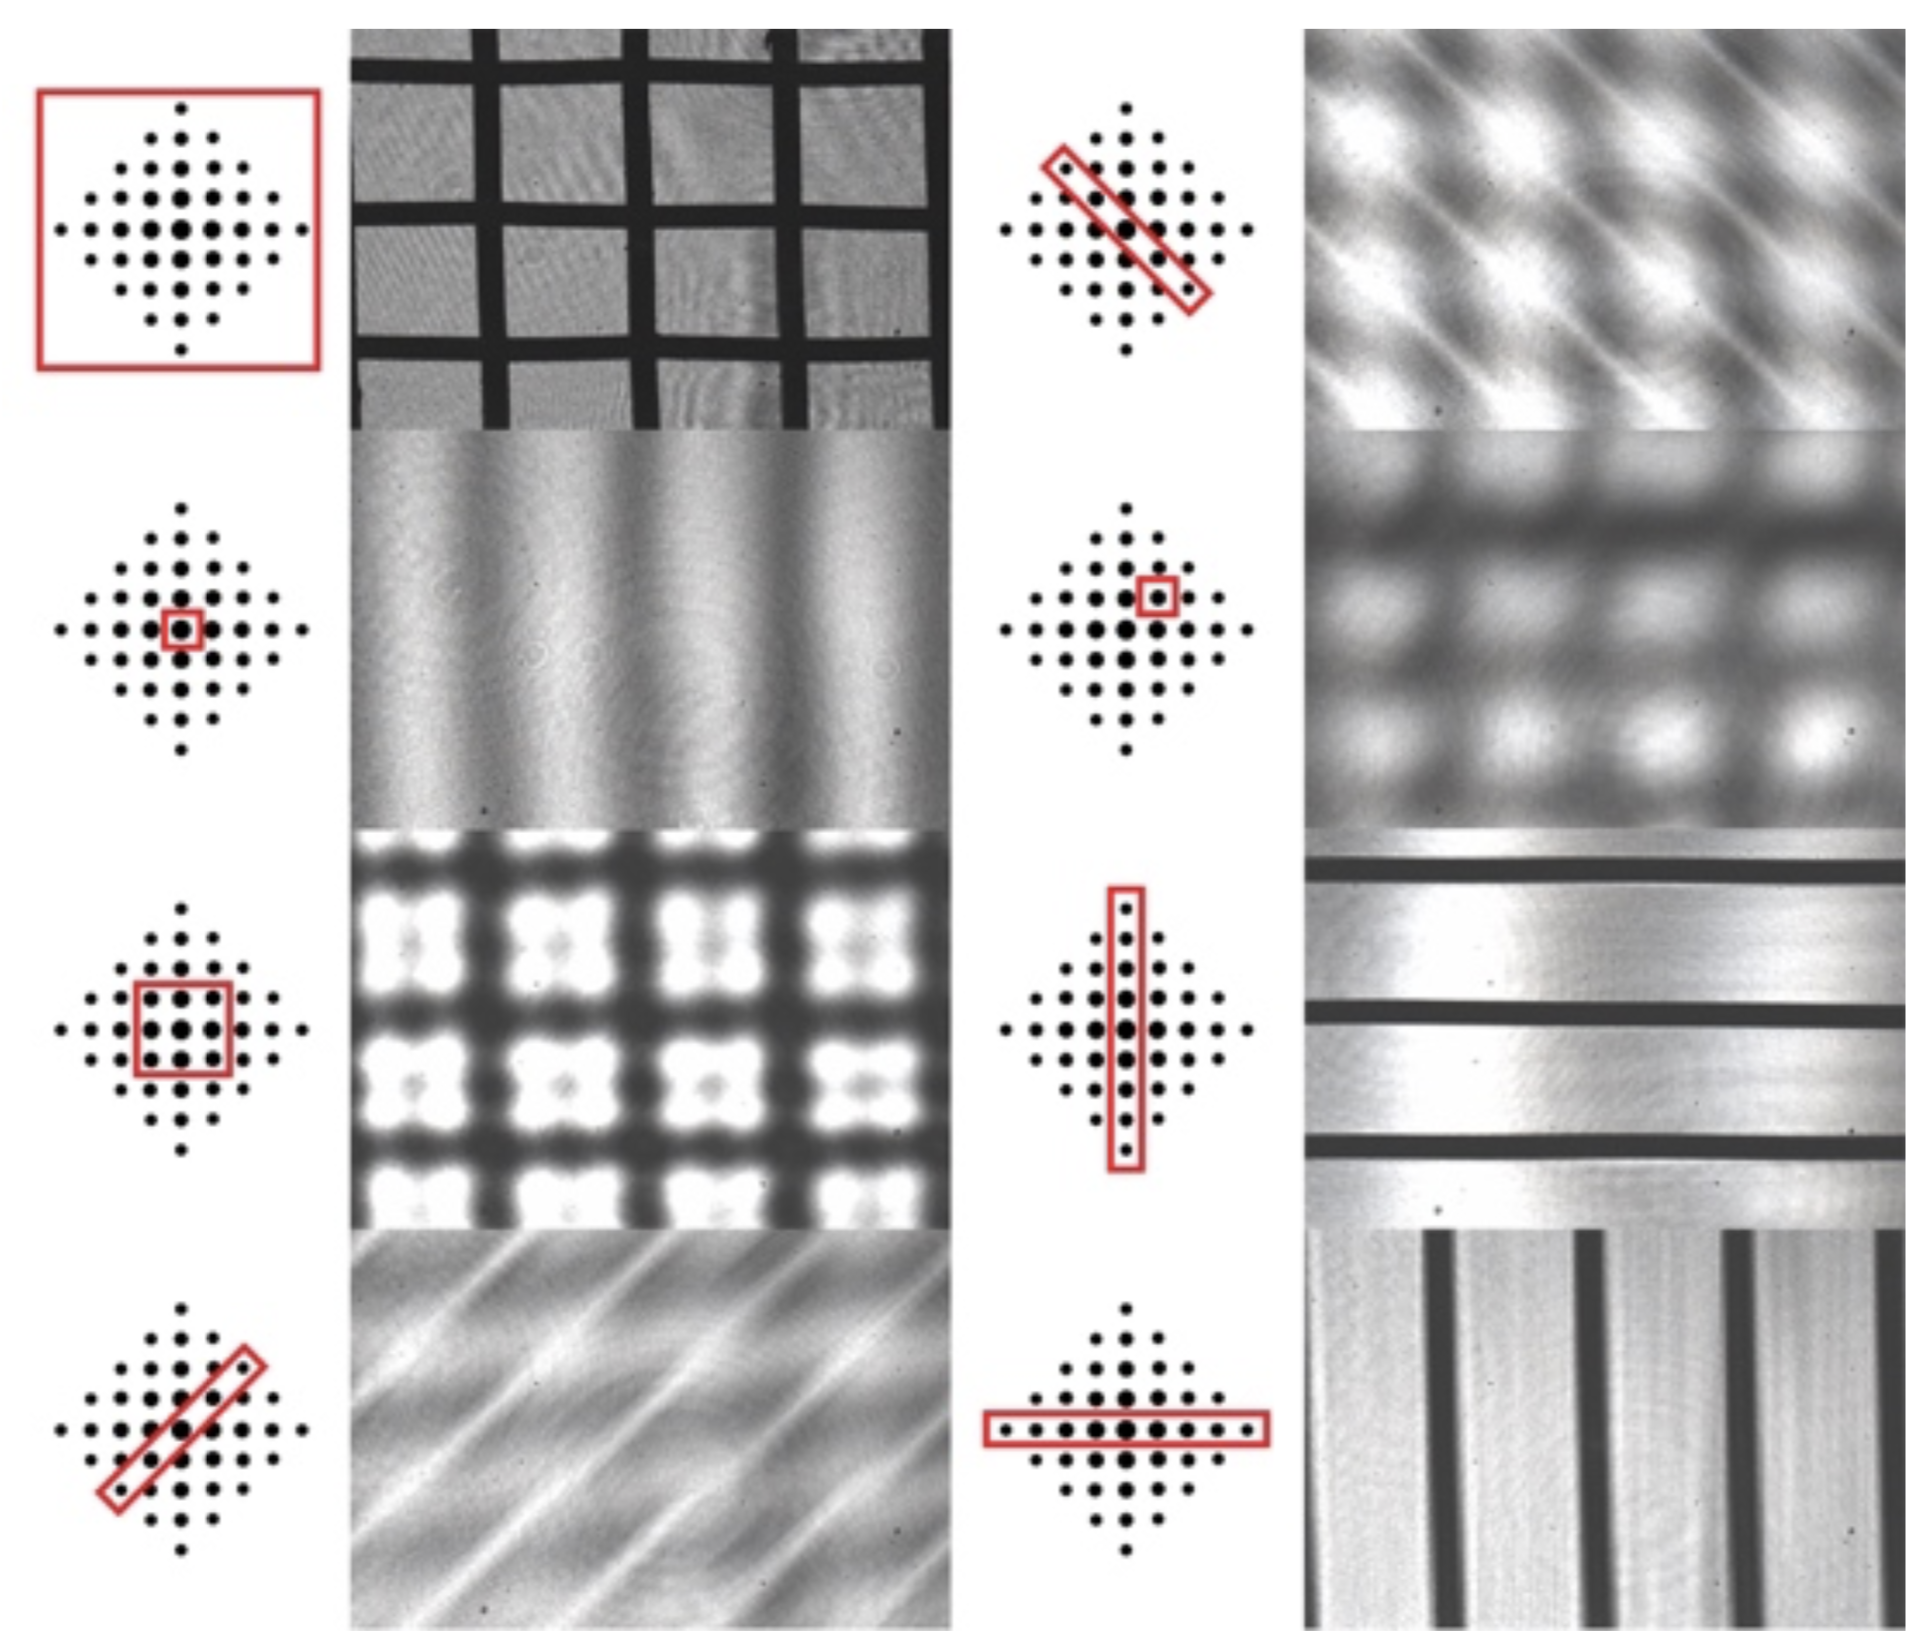
Each of the images above show a diagram of the Fourier pattern on the left and the image that results on the camera from only allowing the portions of the FT highlighted in red. Each one of these is an experimentally-derived result produced by manipulating the optics to block portions of the FT, so it is not quite perfect. The grid of points in the FT has high-frequency detail (things that change in short spaces on the image) close to the edge of the grid, where the low-frequency details (things that are large on the image) are encoded near the center. As you can see, filtering only the signal along one of the axes results in an image that only contains spatial detail along that axis.
The Experiment
Looking at images that someone else produced is a cool way to get started quickly, but it is much better to try it for yourself! Scroll to the bottom of the page (below the line) to find a demo where you can create your own FT filters. The steps to operate it are as follows:
- Click on one of the buttons below "Original Image" to load one of the three example images, or type a URL into the box to load one from the internet (Note: this breaks if you load an image that is too large or on a protected website).
- Click "Compute 2D DFT" to plot the FT in the second area. This will draw the FT and you can click-and-drag on the image to draw a "filter" to block out different parts of the FT.
- Click "Reconstruct Image" in the third area to plot a reconstructed image (what the camera would see in the diagram above). This will also generate a plot (in area 4) where the difference between the original and reconstructed image.
Note: all of this code operates in black and white (because color is too slow).
Give it a try and see if you can reproduce some of the patterns above!